Chart Tools ->
Design
-> Chart Styles
Exam 77-882: Microsoft Excel 2010
Core
6. Presenting Data Visually
6.1. Create charts based on worksheet
data: Modify the Design
Formatting the data in the chart by color and
position helps to tell the story. Here are some options.
3. Try This: Format the Chart Style
Select the Chart and go to Chart Tools.
Go to
Chart Tools ->
Design.
Go to
Chart Styles.
Choose a Style.
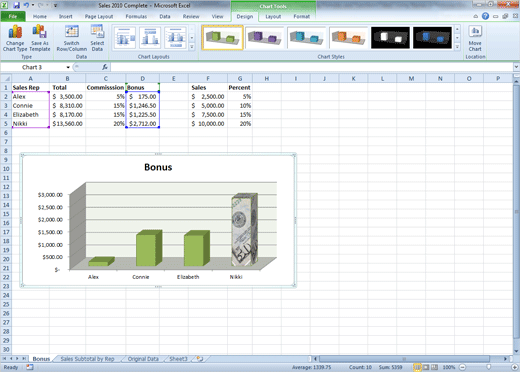
What Do You See? The Chart in this example is
formatting with a Chart Style.
The column that has the most sales has been formatted
with a picture by using the Shape Fill on the Chart
Tools->Format Ribbon. Very good. This works.
Save, save, save. |
|

| |